Hortilights Delivers Results
Our Approach to LED Horticultural Lighting
Humans see lumens. For plants, that a little different story. The only thing the grower is concerned about is the amount of photons that are delivered in the wavelengths that promote photosynthesis. This is then measured in micromoles (µmoles), which is a process of energy that's basically tells you how many photons per meter per second are landing in a square meter per time and what wavelengths.
Why you see purple light out there is people mistakenly have gone with… “Well, chloroplasts A wants wavelength of 660. Chloroplasts B wants wavelength 430 - 450. So that's all we really have to produce in order for a plant to have good vegetation and produce good flowers.” The problem is that a lot of the wavelengths in-between the blue and red wavelengths are used in other chloroplasts and carotenes to provide stalk structure, color, the right kind of color for the leaves, buds, and petals. So that's why we went with a broad spectrum over using the narrowly defined spectrum of blue and red to make that purple light that a lot of our competitors use. We are moving our spectrum away from the blue and red, purple type stuff, because it actually produces healthier plants without adding any energy at all.
We also like to boast our DLI (day light integral). To put it into perspective, a DLI of 100 is a perfect day in the sun for your plants. Imagine 100% being the mid day sun in June or July without any shade. We are the only grow light company out there that can deliver as close to 100 at 99.216% (Spectron fixture). So, we can get a plant to grow indoors to the equivalency of a mid day sun in June or July in a perfect space without any shade. The real growers know that DLI is key for successful growing.
The old school growers don't talk about DLI or µmoles. They're more concerned about "I’ve just always used this high pressure sodium or metal halide.” They all think that their secret sauce is managing the temperature, injecting the right amount of CO2 into the grow rooms, their special blend of nutrients and soli mediums that they use for growing. Those do help in most instances, but the professional growers that are really doing the science know that the money is going with a good DLI. They're reading DR. Cary Mitchell’s study (For those of you who don’t know who he is, he’s a professor at the Purdue Plant Physiology and has performed an amplitude of research form controlled environments to working with NASA and growing plants in space). They know that then need a DLI between 65 and 70% minimum to grow great cannabis, flowers, strawberries, tomatoes, etc. They know that then need a DLI of 35 in their vegetation room. We can help you achieve those high level grows with our hortilight fixtures.

McCree's Original Spectrum in relation to McCree's Weighted and Action Spectrums
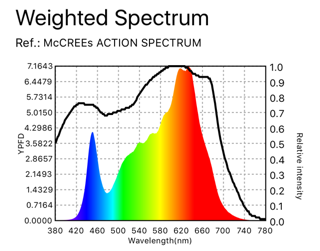
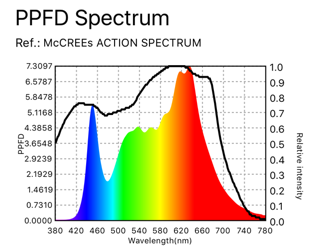
The PPFD, the photonic flux density is in relationship to McCree’s action spectrum, which is the PAR spectrum plants use for photosynthesis. It shows where the particular fixtures spectrum lines up. The weighted spectrum gives more value to the red photons than the blue photons and that's because during the fruiting stages their using more red so they weight the spectrum to the value with more red in there.. It doesn’t really change the number of photons, it just changes how the plant biologist would interoperate it. If you look at the first chart that say PPFD spectrum. Notice the top value is 7.3 µmoles. On the right side of the graph is the relative intensity. So that the 100, being 100% for your max of any one peak wavelength. The left side of the chart is the actual hard value, an actual absolute value. That's how you in how you interoperate that chart. So this is the µmoles/m2/s for each specific wavelength. We peak out at 7.3 in the red. Daylight sun peaks out about 6.6. We put in a little more there and pull out some of the green and mostly the turquoise. The huge dip down there in the cyan area is intentional, which are needed for the carotenes. But it doesn’t need wavelength/color for anything else. We add just enough to keep the carotene production up in a plant. Weighted spectrum would be the chart a biologist would look at to see how it correlates to McCree’s action spectrum. If you notice ours shows that very clearly. That our peak and McCree’s original spectrum unweighted is completely relative color spectrum showing you how much of actual component of light is coming out on each individual wavelengths.
Spectron Spectrums
Growtron Spectrums
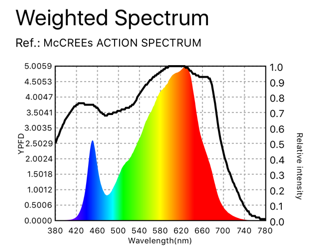
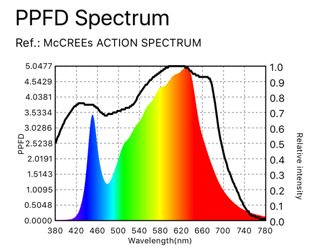
Photron Spectrums
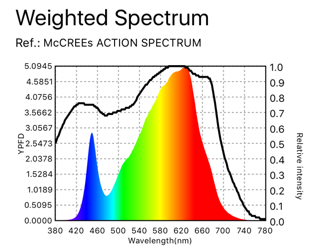
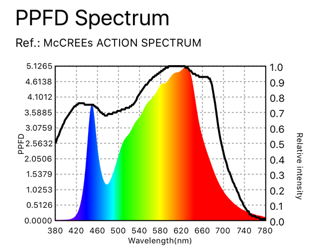
McCree's Spectrum
Cited graph reproduced from: McCree, K.J. 1972a. The action spectrum, absorbance and quantum yield of photosynthesis in crop plants. Agricultural and Forest Meteorology 9, 191-216.
PAR value and PPFD
PAR value – Photosynthetically Active Radiation. This is the amount of light available for photosynthesis measuring from 400 nanometer wavelength to the 700 nanometer wavelength. Basically, it’s the photometric range of the wavelengths, not the actual measurement of it. The numbers you get when using a PAR meter, is actually the photosynthetic photon flux density (PPFD), which is used to quantify the PAR. Most people call it PAR but what they really mean is the PPFD. This is why all of our data shows the PPFD value, not the PAR value. Other companies that boast PAR values and not PPFD should be looked at closer and you should verify that the information is correct.
Hortilights and Lighting Layouts for Grow Rooms
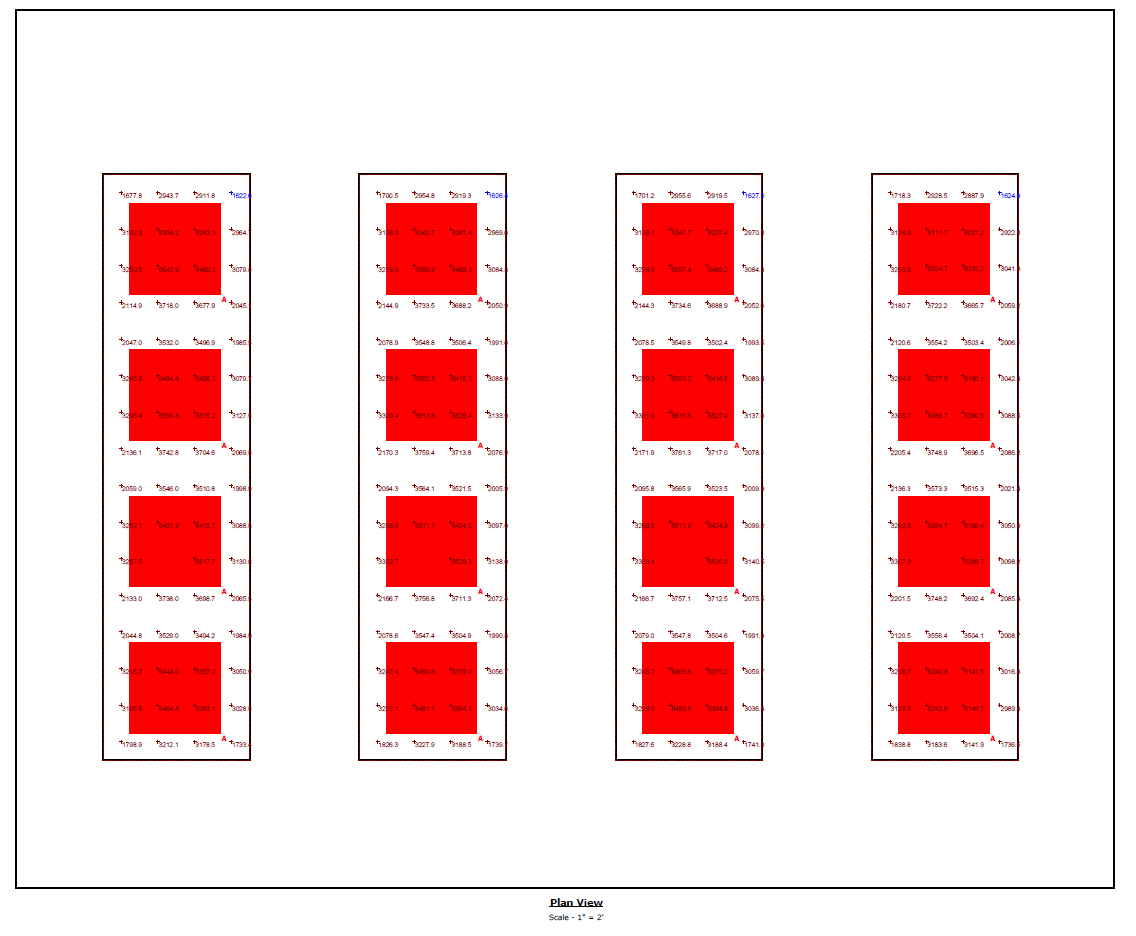
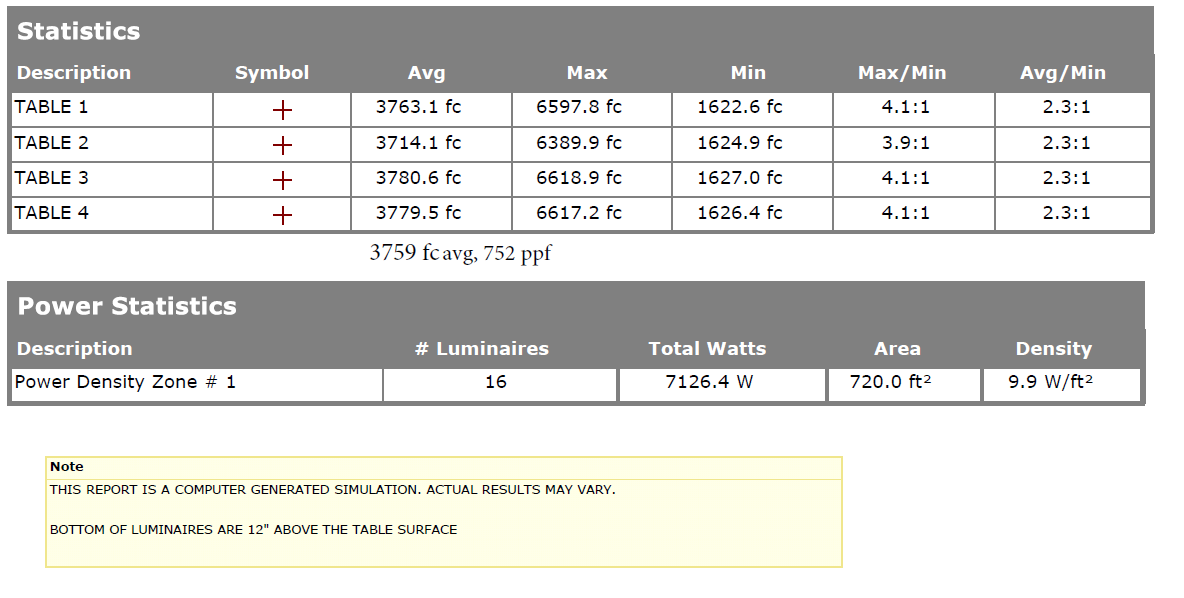
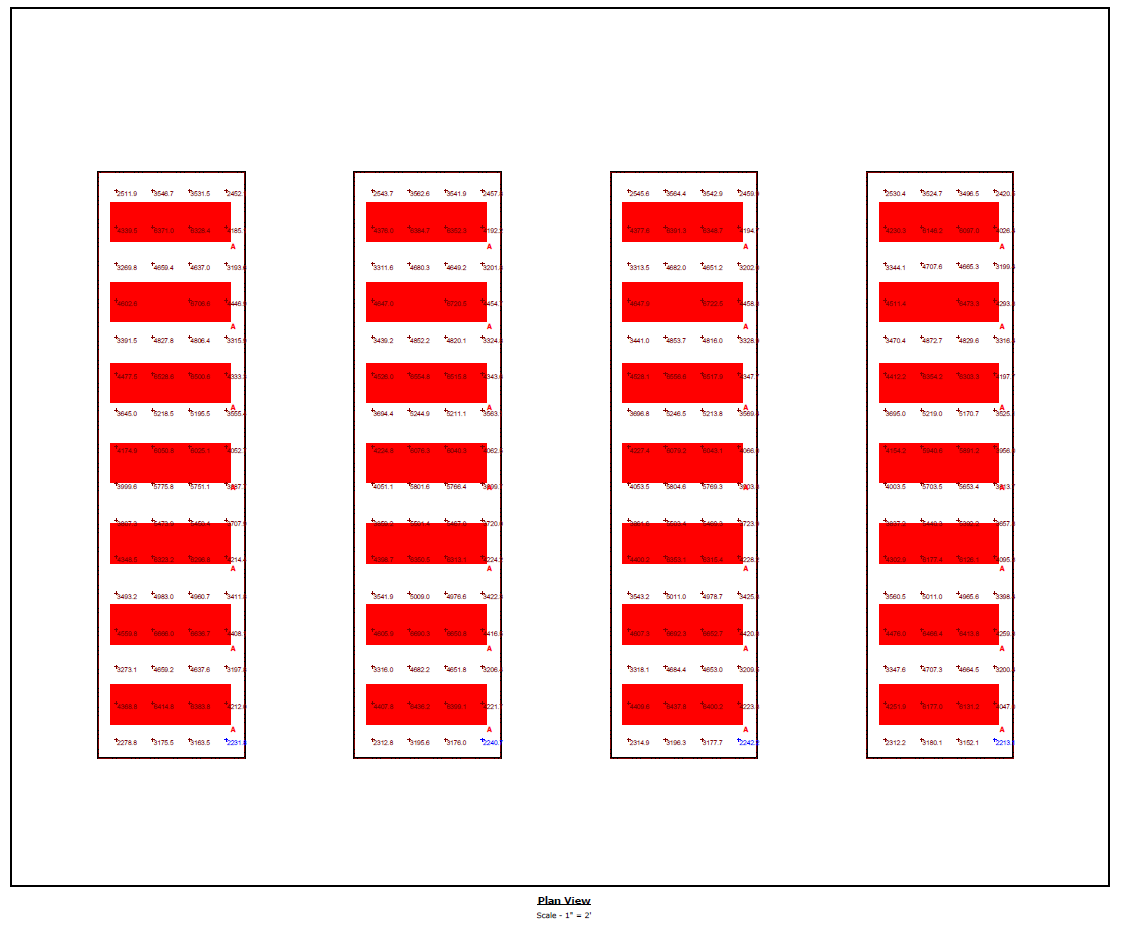
We have the sophistication and ability to provide one nanometer photometry for horticultural lighting layouts. We can plug our info for each light fixture into a light plotting software for agriculture to figure out what they can grow and how to lay it all out (lights and plant spacing). This is all based on the number of photons coming out and delivering the µmoles/m2/s at a specific wavelengths. We break that out into 1 nanometer spreads all the way out into the entire PAR range. So PAR is 400nm wavelengths to the 700nm wavelength. We go above and beyond that and go to 390mn just to cover the entire spectrum of it. We also push all the way out to the far red spectrum, which is not counted in modern par, but it's about 800nm. See the examples below done with the Photron and Growtron fixture.
Photron - Lighting Layout
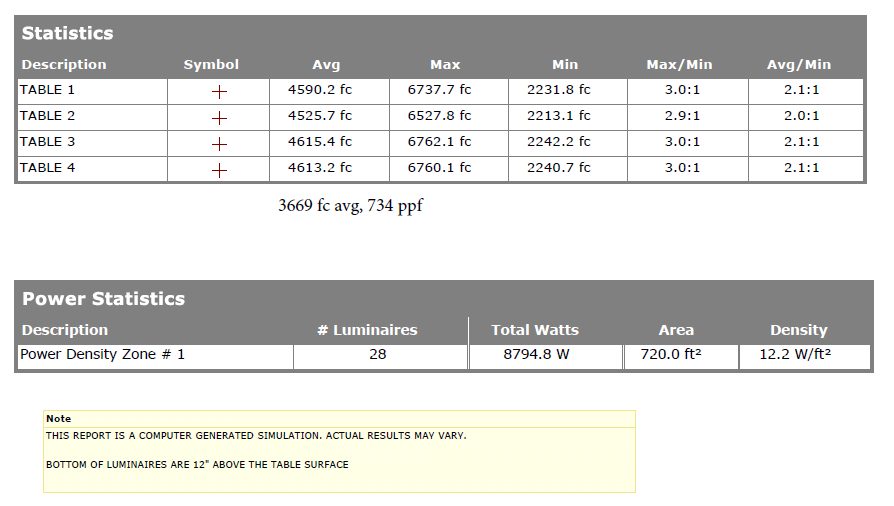
Growtron Layout
